Iowa Crop Progress for the Week Ending October 11, 2026
The weather behind the numbers
Rain at Iowa's three long-record NOAA weather stations -- Des Moines, Mason City and Sioux City -- averaged 2.6 inches from September 26 to October 9, 132% of the 2016-2025 average for those dates. Temperatures averaged 64°F, 2 degrees above normal.
By station: Des Moines 2.5 inches (189% of normal); Mason City 4.4 inches (141% of normal); Sioux City 0.8 inches (56% of normal).
What the Monday report measures
Every Monday from April through November, USDA's National Agricultural Statistics Service publishes Crop Progress. Extension agents and USDA staff in every county report two things: how far along the crop is, and how it looks.
In fall it tracks maturity and harvest -- how much of the crop has dented, and how much is out of the field. The condition rating sorts the crop into very poor, poor, fair, good and excellent. The number the trade quotes is good plus excellent -- "G/E" -- the share of the crop in the top two bands.
How far along Iowa's crop is
Dent is the last stage before the kernel is mature -- the earliest hard read on when combines, grain carts and trucks start rolling.
Iowa and the states around it
| State | Corn good/excellent | Week change | Corn dented | Soybeans good/excellent | Soybeans harvested |
|---|---|---|---|---|---|
| Missouri | 66% | 0 | -- | 58% | 36% |
| Minnesota | 61% | +1 | -- | 61% | 68% |
| Illinois | 60% | +2 | -- | 60% | 48% |
| Wisconsin | 58% | -1 | -- | 55% | 54% |
| Nebraska | 48% | +2 | -- | 55% | 26% |
| South Dakota | 35% | 0 | -- | 44% | 47% |
No corn condition rating published for Iowa this week.
Across the region, corn condition runs from 35% (South Dakota) to 66% (Missouri). Iowa ranks None of 6.
Soybeans
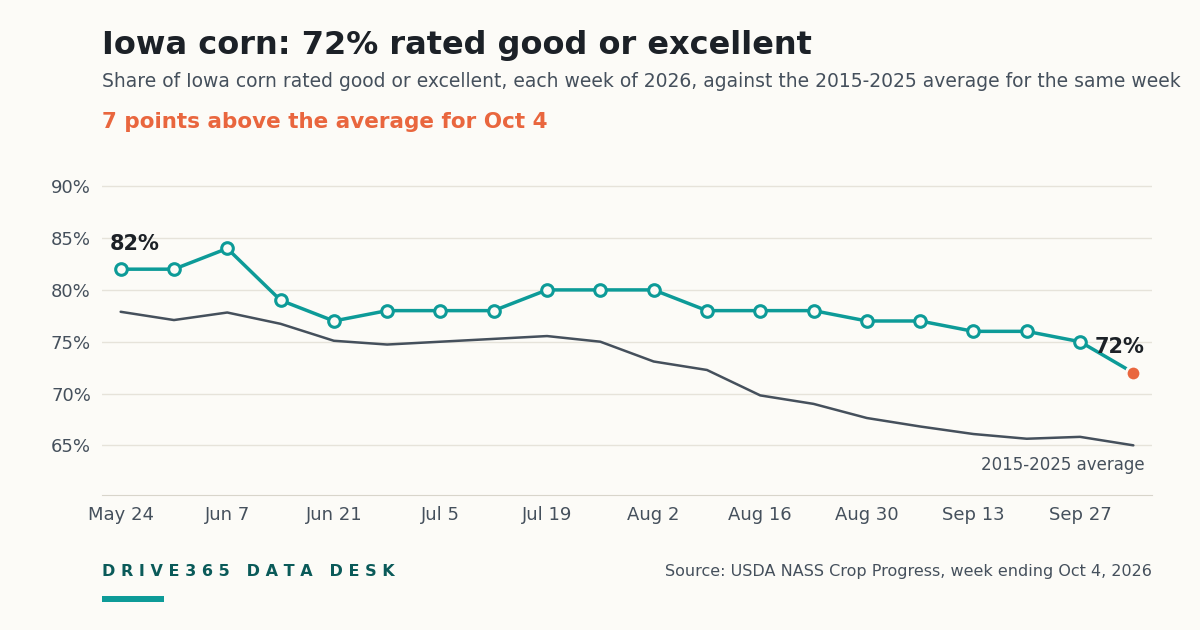
Iowa soybeans were rated 69% good to excellent (-1 on the week), 1st of 7 among the seven states, against 57% nationally.
This week in Iowa corn, every season since 2015
| Season | Corn good/excellent | Corn dented |
|---|---|---|
| 2024 | 76% | -- |
| 2023 | 48% | -- |
| 2022 | 63% | -- |
| 2021 | 62% | -- |
| 2020 | 44% | -- |
| 2019 | 65% | 97% |
| 2018 | 69% | -- |
| 2017 | 60% | -- |
| 2016 | 81% | -- |
| 2015 | 80% | -- |
Harvest and the freight that moves it
USDA has not started reporting Iowa's harvest yet. When the combines do roll, every bushel goes field to elevator by truck; from there, rail and barge carry it out of state.
U.S. railroads originated 26,643 grain carloads in the week ending October 3, 2026, 3.5% fewer than the same week a year earlier.
Downbound grain barge rates on the Mid-Mississippi -- the stretch that carries Iowa and Minnesota grain toward the Gulf -- stood at 839% of tariff for the week of October 6, down from 850% four weeks earlier. The rate is quoted as a percentage of a 1976 benchmark tariff, so a higher number means a costlier barge.
The week ahead
The National Weather Service forecast issued Tuesday at 12:00 PM CT covers Tuesday, October 13 through Monday, October 19. It is reported here as the Weather Service issued it; the Data Desk does not forecast.
| City | Highs | Lows | Days with a 50%+ chance of rain |
|---|---|---|---|
| Des Moines | 58-69°F | 36-59°F | Thu |
| Cedar Rapids | 59-74°F | 36-64°F | Tue, Wed, Thu |
| Dubuque | 56-73°F | 34-63°F | Thu |
Who watches this number, and why
| Why this week's report matters to them | |
|---|---|
| Corn and soybean grower | Pace and condition against the neighbors and against past years -- the yardstick buyers use. |
| Grain elevator | Harvest pace sets when bushels hit the scale and how fast bins and dryers fill. |
| Livestock feeder, ethanol plant | Condition ratings are the most-watched read on the crop they buy all year. |
| Equipment and parts dealer | Harvest progress is when breakdowns, service calls and parts orders peak. |
| Trucking | Harvest pace is when field-to-elevator hauling starts; rail and barge show how fast grain leaves the elevator. |
Why an Iowan should care
Iowa grows more corn than any other state, and almost none of it stays in the field it grew in. From now until the last report of the season, the numbers above turn into trucks on county roads, lines at the elevator, and trains and barges leaving for the river and the coast. Every bushel moves on a truck first.
Source: USDA National Agricultural Statistics Service, Crop Progress, week ending October 11, 2026, and prior Crop Progress reports back to 2015. Condition is the share of the crop rated good or excellent; progress figures are the share of planted acres at that stage. Same-week averages are computed by the Drive365 Data Desk and can differ slightly from NASS's published five-year average. Rail carloads: USDA Agricultural Marketing Service (AgTransport) weekly Class I grain carloadings. Barge rates: USDA AMS Grain Transportation Report, downbound grain barge rates. Recent weather: NOAA NCEI Global Historical Climatology Network daily summaries (Des Moines, Mason City, Sioux City); statewide monthly figures: NOAA NCEI Climate at a Glance. Forecast: National Weather Service (api.weather.gov), as archived by the Drive365 Data Desk.
Compiled automatically by the Drive365 Data Desk from published USDA data. Generated 2026-10-13 20:03 UTC. This page reports published figures and the arithmetic on them. It does not forecast yields or prices or offer trading or business advice.
 Brought to you byJEMSSteel, tools and shop supply.Visit jems.store
Sponsorship supports the Data Desk. Sponsors have no input into what it reports; every figure above comes straight from the published source.
The Data Desk, weekly. One email every Saturday with the week's Data Desk numbers. Unsubscribe any time. Get the weekly email
Advertise on the Data Desk. Put your business in front of Iowa farmers, grain buyers and the companies that serve them, next to the numbers they read the day USDA releases them. Ask about sponsoring an article