U.S. Soybean Export Sales Are 80% Ahead of Last Year's Pace
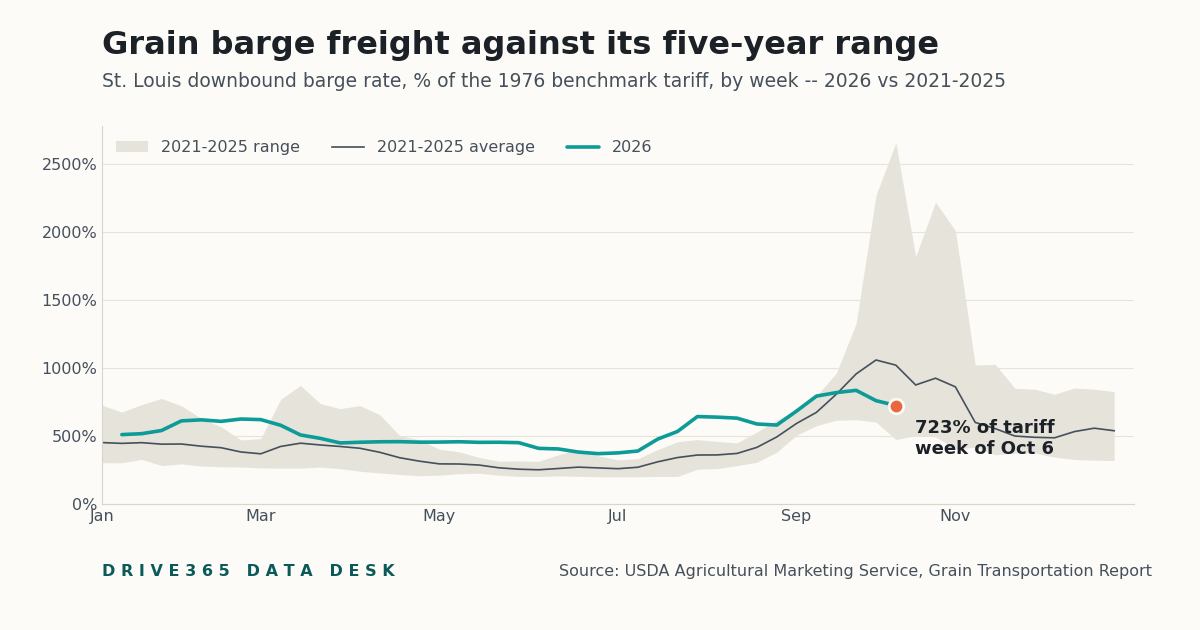
U.S. soybean export commitments total 22.8 million metric tons, 80% more than at this point last year and 10% above the five-year average for this point of the marketing year. Barge freight from St. Louis stood at 723% of tariff. These are the figures USDA published Thursday, October 8.
This week's freight numbers
| This week | Week ago | Year ago | |
|---|---|---|---|
| Barge rate, St. Louis (% of tariff) | 723% | 759% | 474% |
| Barge rate, Mid-Mississippi (% of tariff) | 839% | 846% | 622% |
| Grain truck cost index (2017 = 100) | 234 | 241 | 140 |
| Grain barge cost index (2017 = 100) | 249 | 248 | 186 |
| Rail shuttle cost index (2017 = 100) | 134 | 130 | 124 |
| Ocean freight, Gulf to Japan, index (2017 = 100) | 193 | 193 | 144 |
| U.S. grain rail carloads originated | 26,643 | 29,862 | 27,598 |
This week's export sales
| Thousand metric tons | Net sales this week | Shipped so far | Sold, not yet shipped | Total commitment | Same point a year ago |
|---|---|---|---|---|---|
| Corn | 769 | 7,402 | 12,142 | 19,543 | 29,411 |
| Soybeans | 549 | 3,935 | 18,850 | 22,785 | 12,664 |
For the week ending October 1, week 5 of the 2026-27 marketing year.
What the numbers measure
Barge rates are quoted as a percent of a benchmark tariff the government set in 1976 for moving grain down the rivers. The tariff itself no longer applies, but the trade still prices against it: 100% is the 1976 rate, and 800% is eight times that rate. A higher percent means it costs more to float a ton of grain to the Gulf of Mexico, where most U.S. corn and soybean exports load onto ships.
Export sales come in three numbers. Net sales are new contracts booked that week, minus cancellations. Exports are grain that physically left the country. Outstanding sales are sold but not yet shipped. Shipped plus outstanding is the total commitment -- everything foreign buyers have bought this marketing year, which for corn and soybeans began September 1.
USDA's grain transportation cost indices track the cost of moving grain by each mode against 2017, which is set to 100: an index of 150 means that mode costs half again what it did in 2017.
The Drought Monitor sorts every part of the country into classes each week: D0 is abnormally dry, and D1 through D4 are moderate, severe, extreme and exceptional drought. "D1 or worse" is the share in actual drought.
Against the last five years
In the same weeks of the past five years, the St. Louis barge rate ran between 474% and 2653% of tariff. This week's 723% is inside that range. Against the same week last year it is 53% higher.
U.S. corn export commitments are 3% below the five-year average for this point of the marketing year and 34% less than a year ago.
U.S. soybean export commitments are 10% above the five-year average for this point of the marketing year and 80% more than a year ago.
Iowa drought
On the Drought Monitor map dated October 6, 0.0% of Iowa was in moderate drought or worse, against 0.0% a week earlier and 0.9% a year ago. Including abnormally dry areas, 1.4% of the state was marked.
Who this helps and who it squeezes
| What this week's numbers mean | |
|---|---|
| Barge and towboat operators | Helps when barge rates rise. The rate is their revenue per ton. |
| Grain sellers near the river | Squeezes when barge freight is expensive. River elevators pay for that freight out of what they bid for grain. |
| Grain truckers and rail shippers | Helps when river freight is costly. Grain that would have floated looks for another way to a buyer. |
| Farmers, elevators and exporters | Helps when export sales run strong. More of the crop has a buyer overseas. |
Why an Iowan should care
Iowa's corn and soybeans leave the state three ways: by truck to processors and river terminals, by rail to the Pacific Northwest and the Gulf, and by barge from the Mississippi along Iowa's eastern border -- the Mid-Mississippi rate in the table. What it costs to move grain on each of those, and how much of it foreign buyers have bought, shows up in what an Iowa elevator can pay for a bushel. This is harvest, when the most grain moves and freight is in the most demand.
Sources: USDA Agricultural Marketing Service -- Grain Transportation Report (downbound grain barge rates, week of October 06, 2026; grain transportation cost indicators; Class I rail grain carloadings); USDA Foreign Agricultural Service -- U.S. Export Sales (corn and soybeans, week ending October 01, 2026); U.S. Drought Monitor (National Drought Mitigation Center, USDA, NOAA), map of October 06, 2026. Bushels use USDA's standard factors (39.368 bushels per metric ton of corn, 36.744 of soybeans). Comparisons with earlier years are arithmetic on those published figures.
Compiled automatically by the Drive365 Data Desk from published USDA and Drought Monitor data. Generated 2026-10-08 22:50 UTC. This page reports published figures and the arithmetic on them. It does not forecast prices or offer trading or business advice.
 Brought to you byJEMSSteel, tools and shop supply.Visit jems.store
Sponsorship supports the Data Desk. Sponsors have no input into what it reports; every figure above comes straight from the published source.
The Data Desk, weekly. One email every Saturday with the week's Data Desk numbers. Unsubscribe any time. Get the weekly email
Advertise on the Data Desk. Put your business in front of Iowa farmers, grain buyers and the companies that serve them, next to the numbers they read the day USDA releases them. Ask about sponsoring an article