USDA Has Raised Its Corn Carryout 18% Since September
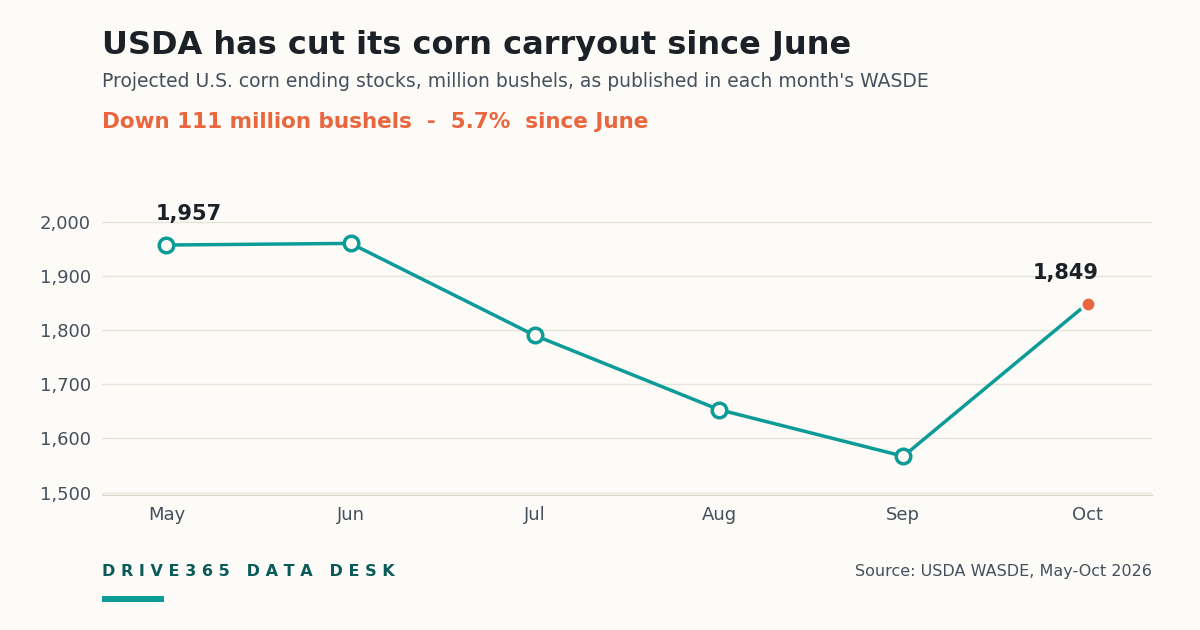
USDA put 2026/27 U.S. corn carryout at 1,849 million bushels in the October 2026 WASDE, up 282 million from the month before.
Once a month, USDA publishes that report -- WASDE, World Agricultural Supply and Demand Estimates. It is a balance sheet for the country's grain: how much we'll grow, how much we'll use, and how much will be left over. That last number is the one traders watch.
What "ending stocks" actually means
Ending stocks, or carryout, is the corn still sitting in bins on the day the next harvest starts. It's the buffer between one crop and the next.
A big carryout means slack in the system -- a drought or an export surge can be absorbed without much happening to price. A small one means no cushion, and prices get twitchy, because any surprise has to be rationed by cost rather than by inventory.
USDA doesn't measure carryout. It projects it, then revises the projection every month as the crop and the demand picture come into focus. So each monthly number is not a fresh fact -- it's the latest draft of the same estimate.
The revision history
Here is how USDA has walked its 2026/27 corn carryout since it first published the figure in May:
| WASDE report | Ending stocks (mil bu) | Change |
|---|---|---|
| May 2026 | 1,957 | -- |
| June 2026 | 1,960 | +3 |
| July 2026 | 1,790 | -170 |
| August 2026 | 1,653 | -137 |
| September 2026 | 1,567 | -86 |
| October 2026 | 1,849 | +282 |
From the September low, the projected buffer has grown 282 million bushels -- 18.0% -- in one month.
The crop explains most of it
The intuitive reason for a growing carryout is a big harvest. Here is USDA's production estimate over the same reports:
| WASDE report | Production (mil bu) |
|---|---|
| May 2026 | 15,995 |
| June 2026 | 15,995 |
| July 2026 | 16,000 |
| August 2026 | 16,013 |
| September 2026 | 15,800 |
| October 2026 | 16,034 |
Production is up 234 million bushels from its low -- most of the 282-million-bushel increase to carryout.
USDA's price forecast moved the other way
The same report carries a season-average farm price -- roughly what USDA expects the average farmer to receive across the marketing year.
$4.40 in May, June and July. $4.50 in August. $4.80 in September. $4.70 in October.
Up 30 cents, or 6.8%, in three reports.
On a 50,000-bushel crop, a 30-cent move is $15,000 in gross revenue -- same acres, same bins, same work.
Who this helps and who it squeezes
A looser carryout is not good news or bad news. It is good news for the people who sell corn and bad news for the people who buy it, and Iowa is full of both.
| What a looser carryout and a higher price mean | |
|---|---|
| Corn grower | Helps. USDA's price forecast is 30¢/bu above July. Same crop, more revenue per bushel. |
| Cattle feedlot, hog producer | Squeezes. Corn is the feed bill. The grower's 30¢ is their 30¢, in the other direction. |
| Ethanol plant | Squeezes. Corn is the raw input; margin depends on the gap to fuel prices. |
| Grain elevator | Mixed. More grain to handle and carry, at a lower value per bushel. |
| Trucking | Roughly neutral on price. The bushels still move either way -- price changes what they're worth, not how many tons need hauling. |
This is the part a national ag publication usually leaves out, because its reader is assumed to be a grower. In Iowa the same reader is often on both sides of the table: the farm that sells corn may also feed cattle.
Why an Iowan should care
Iowa grows more corn than any other state, and almost none of it stays put. Corn becomes feed for the cattle and hogs a few counties over, ethanol at the plant down the road, or an export that leaves by rail and barge. A looser carryout lowers the cost of the first two and the value of the third -- and every bushel of it, in every direction, moves on a truck first.
Source: USDA World Agricultural Supply and Demand Estimates (WASDE), May 2026 through October 2026 releases. Ending stocks and production in million bushels; season-average farm price in dollars per bushel. All figures are USDA projections for the 2026/27 marketing year as published in each month's report, and each is subject to revision in the next one. The dollars example applies USDA's published price change to an illustrative 50,000-bushel crop.
Compiled automatically by the Drive365 Data Desk from published USDA data. Generated 2026-10-09 16:00 UTC. This page reports published figures and the arithmetic on them. It does not forecast prices or offer trading or business advice.
 Brought to you byJemsCutSendLaser cutting and fabrication, on demand.Visit jemscutsend.com
Sponsorship supports the Data Desk. Sponsors have no input into what it reports; every figure above comes straight from the published source.
The Data Desk, weekly. One email every Saturday with the week's Data Desk numbers. Unsubscribe any time. Get the weekly email
Advertise on the Data Desk. Put your business in front of Iowa farmers, grain buyers and the companies that serve them, next to the numbers they read the day USDA releases them. Ask about sponsoring an article